Figure x shows the changes in vertical drifts seen at Jicamarca on day 93 on day 93 and day 94, 2004 (2 and 3 April). The red line is those calculated by CMIT 2.0 (which includes the NCAR-TIEGCM, which has an interactive low latitude dynamo), whereas the data measured by the Incoherent Scatter Radar (ISR) are represented by blue crosses. The CMIT 2.0 vertical ion drifts are also plotted in red in the lower plot, and the Bz values, that have been adjusted to account for the time taken to reach Earth from the L1 point, are plotted in green. This latter comparison shows the relationship between changes in Bz and rapid excursions of vertical drift at the magnetic equator. The first day of this simulation had very low geomagnetic activity. A geomagnetic storm affected the Earth’s ionosphere early on the 3rd. This activity continued through past the end of this day.
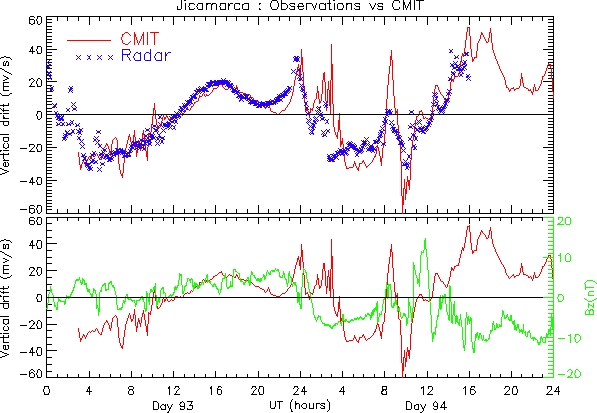
Figure x: The top panel shows the modeled vertical drifts at Jicamarca (red line) and the ones observed by the Jicamarca ISR (blue crosses). The bottom panel shows the the same modeled vertical drifts (red line) and the IMF Bz value (green line). Both of these panels are for the 2nd and 3rd of April 2004. The first of these days was geomagnetically quiet; a geomagnetic storm occurred on the 3rd.
CMIT 2.0 models quiet-time, vertical ionospheric drifts fairly well. It reproduces the timing of the variations seen in the data, but it overestimates the amplitudes of the variations seen from 0400 UT to 1200 UT on day 93. These variations occur during the nighttime, when the high latitude electric fields are able to affect the electric field at the equator, even during this quiet interval. Variations in the electric field are in close agreement through the rest of the daytime hours, up to and including the prereversal enhancement. The daytime variations appear to be driven primarily by the low latitude dynamo and the model of this dynamo is in good agreement with the observed one. The prereversal enhancement is a combination of both the neutral wind dynamo and penetration electric fields. CMIT 2.0 reproduces both the timing and the amplitude of this enhancement.
CMIT 2.0 also reproduces most of the variations that were seen in the observations during the storm. However, it significantly overestimates the magnitude of the vertical drifts during this period. This difference in amplitudes is probably caused by two factors: the LFM model overestimates the high latitude electric field; and it produces a weak region 2 current that undershields these electric fields. Thus, stronger electric fields are leaked into lower latitudes. The forthcoming inclusion of the RCM in the LTR model should supply the necessary missing shielding and thus reduce the amplitudes of the modeled vertical drifts at Jicamarca, bringing them into better agreement with the observations.